About The Project
This project presents a comprehensive analysis of Indian states and Union Territories, examining demographic, economic, and social indicators. The study covers population growth trends from 1901 to 2024, economic performance through GDP analysis, educational progress via literacy rates, and religious demographics across different regions of India.
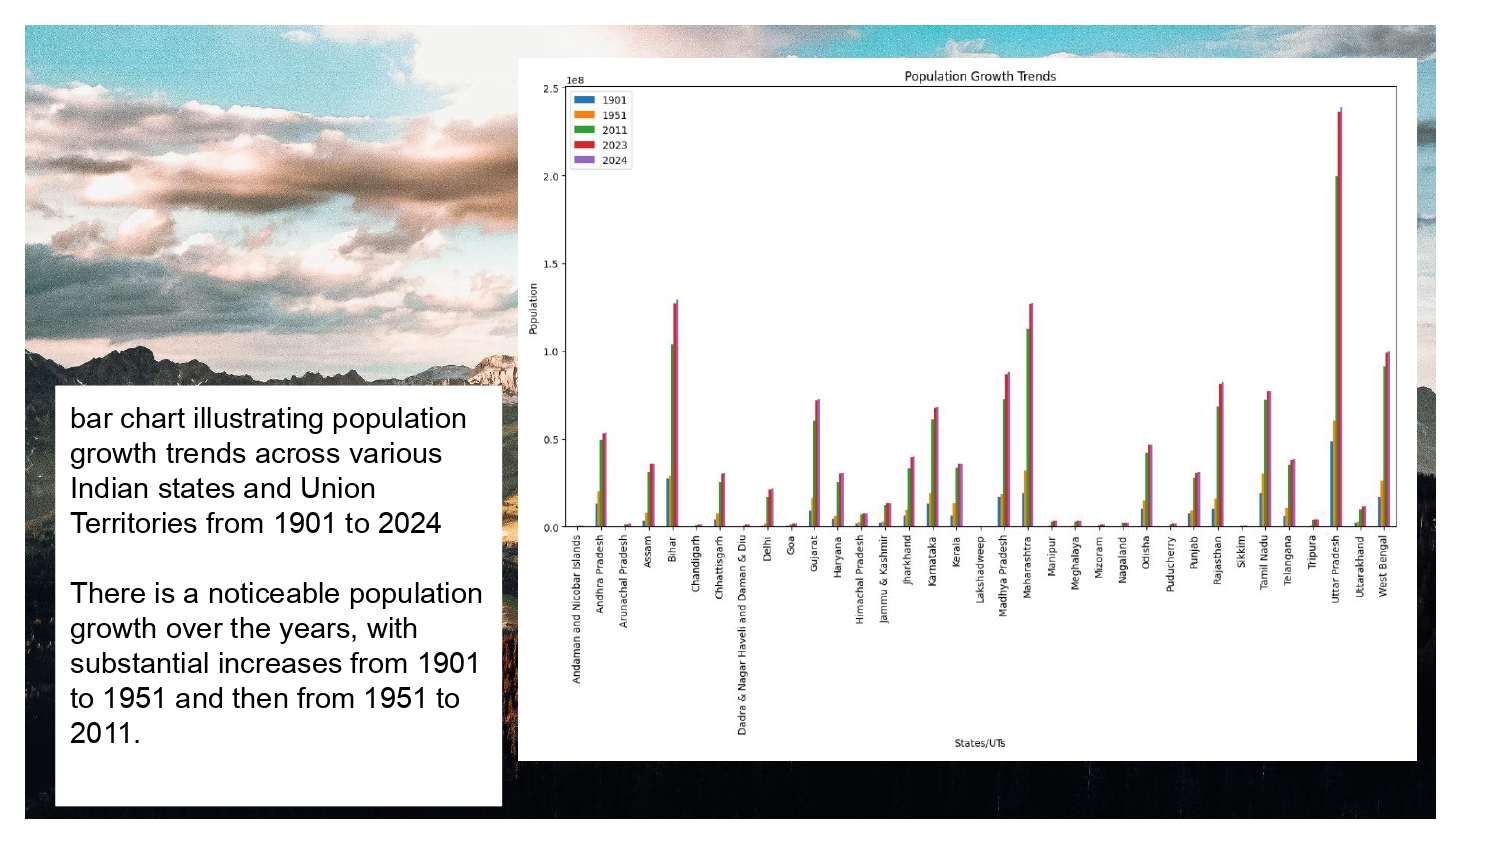
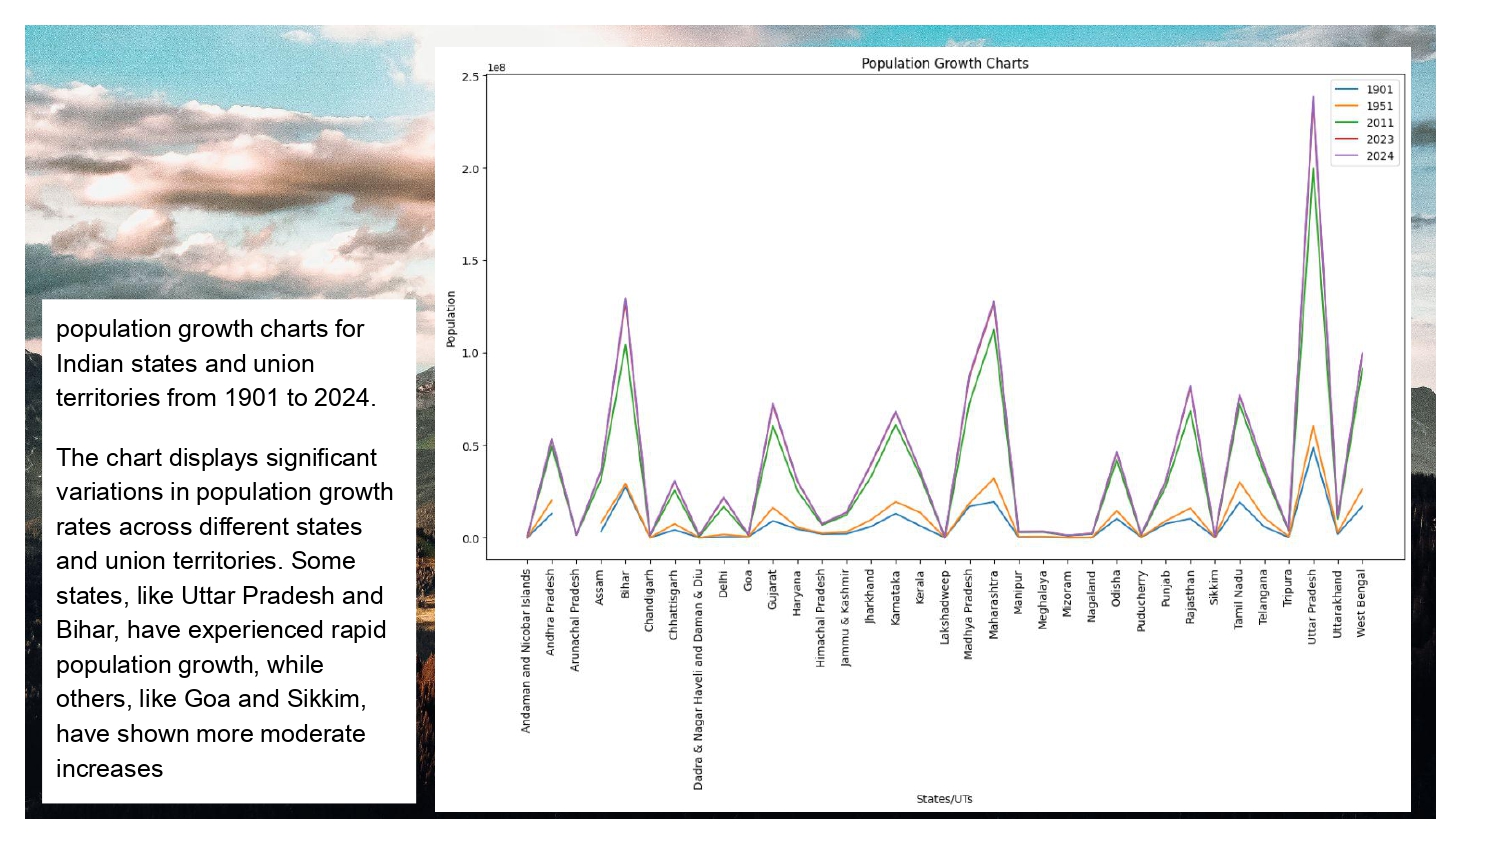
Population Growth Trends (1901-2024)
- Noticeable population growth over the years with substantial increases from 1901 to 1951 and then from 1951 to 2011.
- Some states like Uttar Pradesh and Bihar have experienced rapid population growth.
- Others like Goa and Sikkim have shown more moderate increases.
- Significant variations in population growth rates across different states and union territories.
- Positive correlation between area and population indicating larger areas tend to have larger populations.
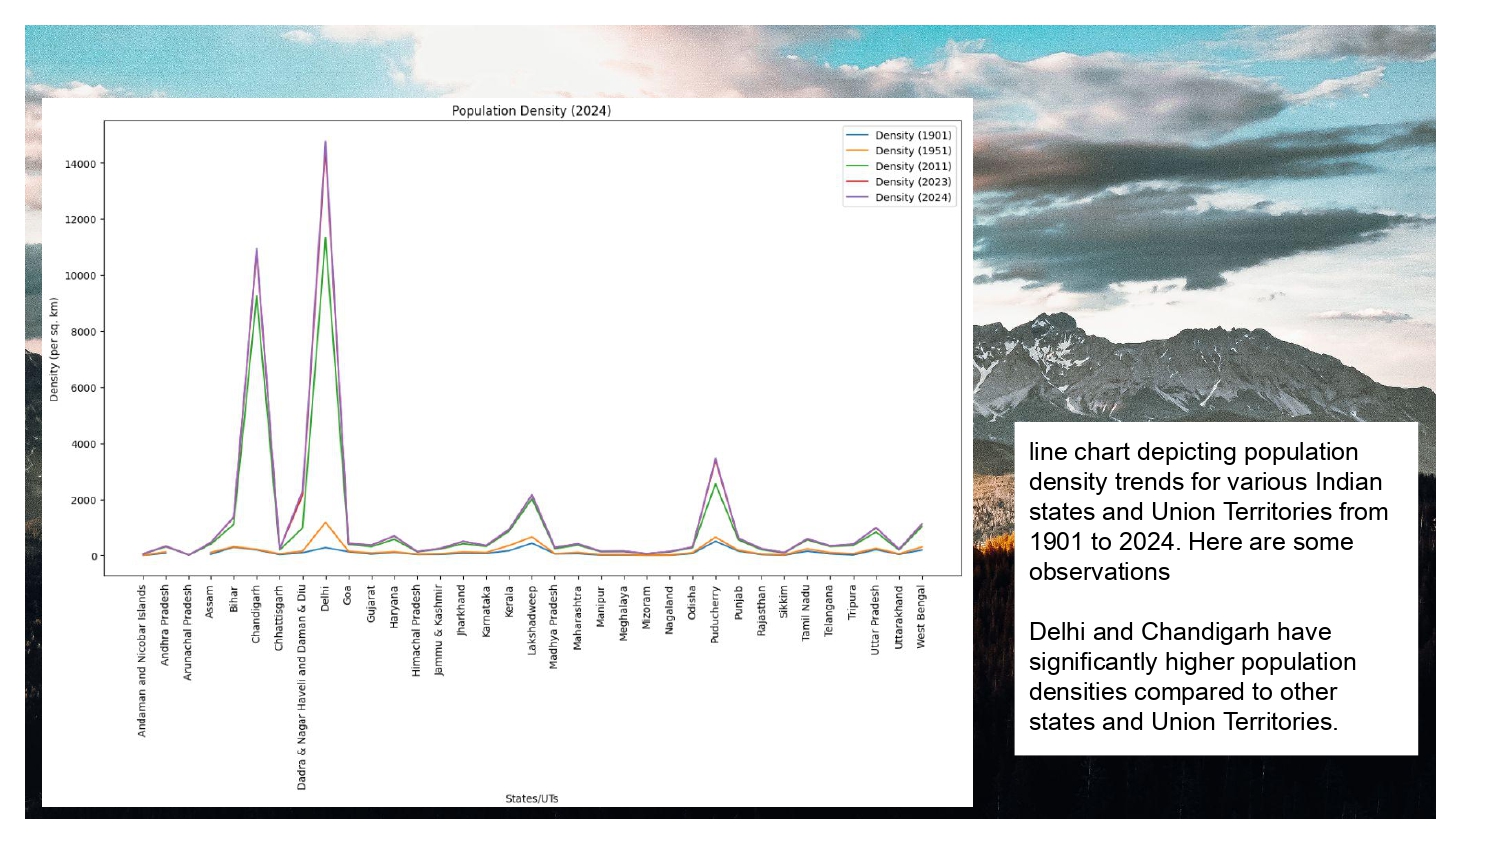
Population Density Analysis
- Delhi and Chandigarh have significantly higher population densities compared to other states and Union Territories.
- Line chart depicting population density trends for various Indian states and Union Territories from 1901 to 2024.
- Clear distinction between urban and rural population distribution patterns.
- Metropolitan areas show concentrated population patterns compared to rural regions.
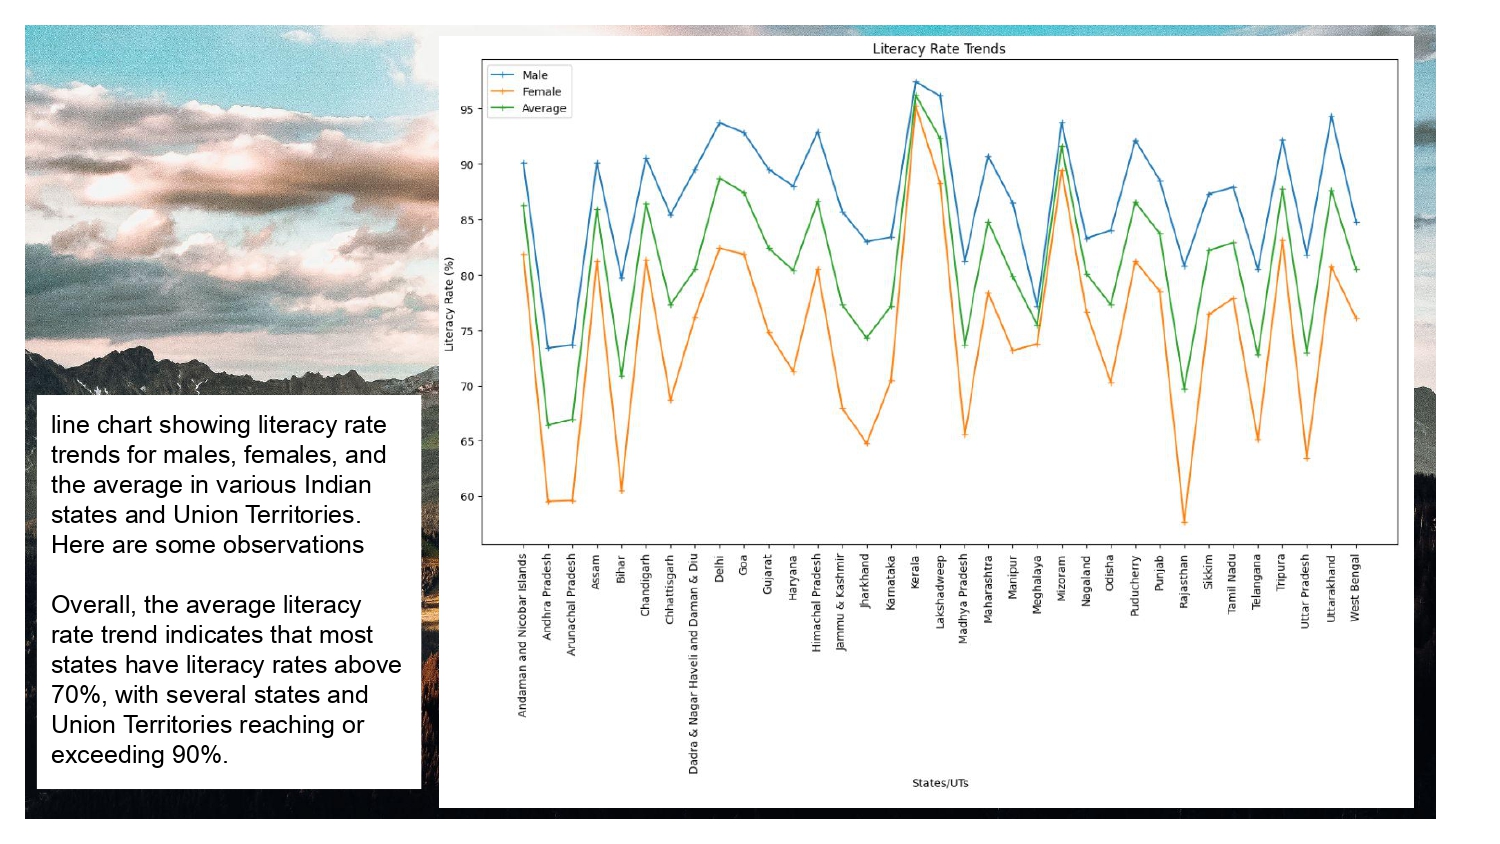
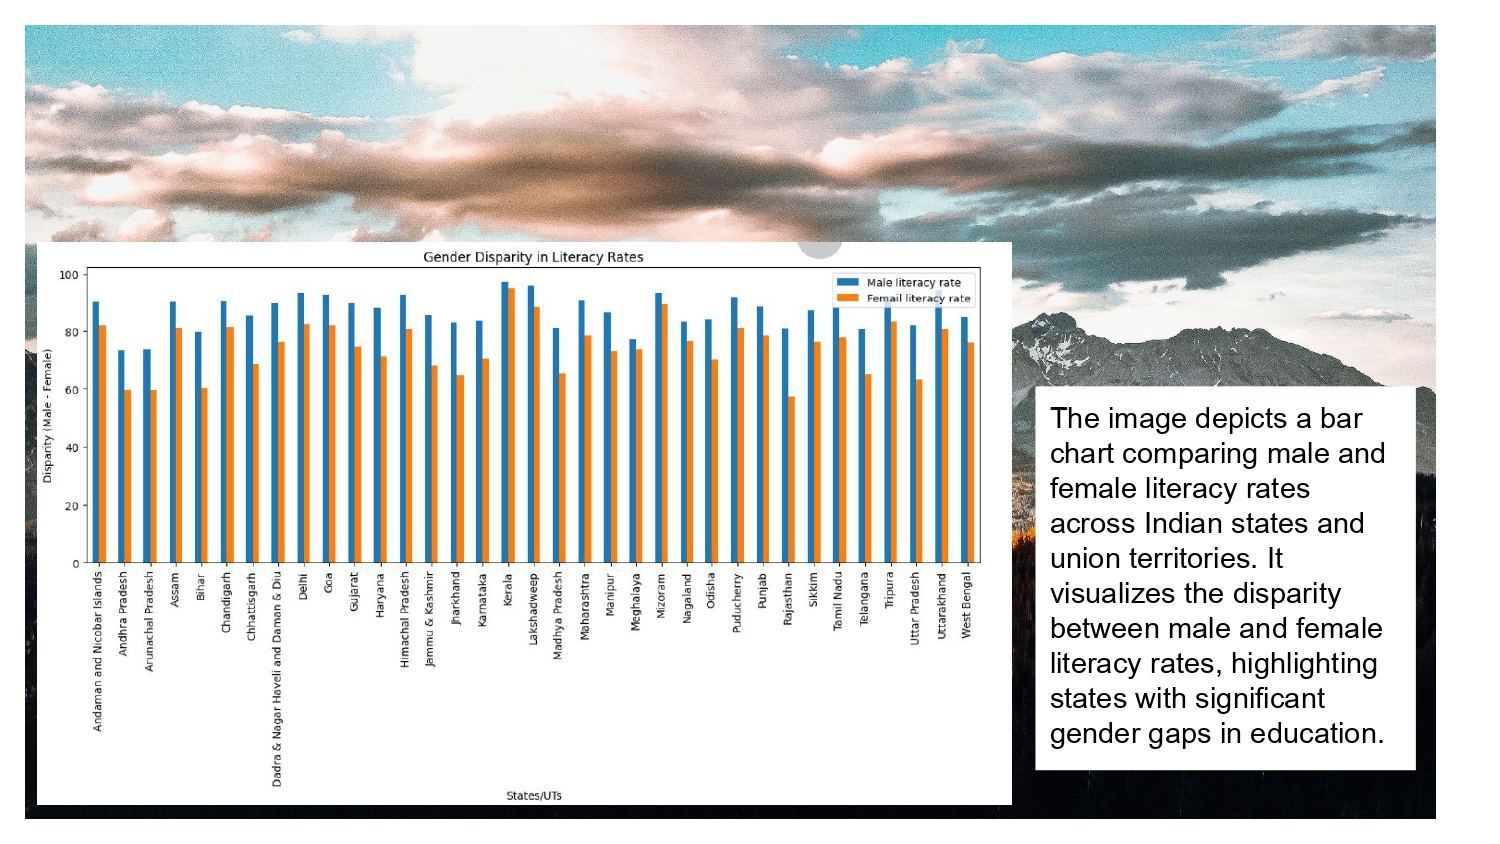
Literacy Rate Trends
- Overall, the average literacy rate trend indicates that most states have literacy rates above 70%.
- Several states and Union Territories reaching or exceeding 90% literacy rates.
- Line chart showing literacy rate trends for males, females, and the average across various Indian states and Union Territories.
- Bar chart comparing male and female literacy rates highlighting states with significant gender gaps in education.
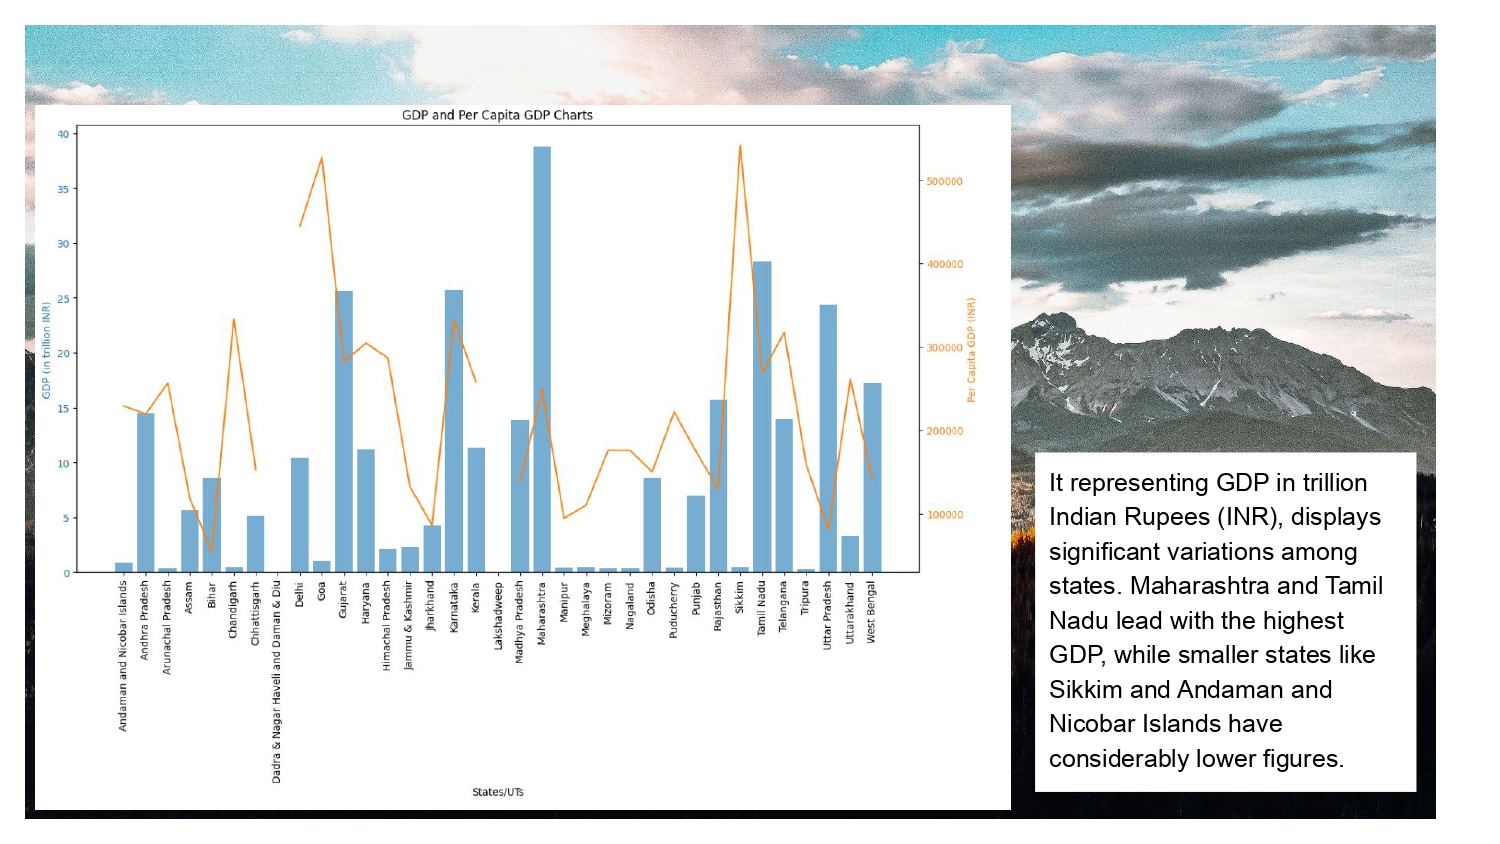
GDP Distribution Analysis
- GDP represented in trillion Indian Rupees (INR) displays significant variations among states.
- Maharashtra and Tamil Nadu lead with the highest GDP contributions to the national economy.
- Smaller states like Sikkim and Andaman and Nicobar Islands have considerably lower GDP figures.
- Regional analysis shows varying economic contributions across different zones of India.
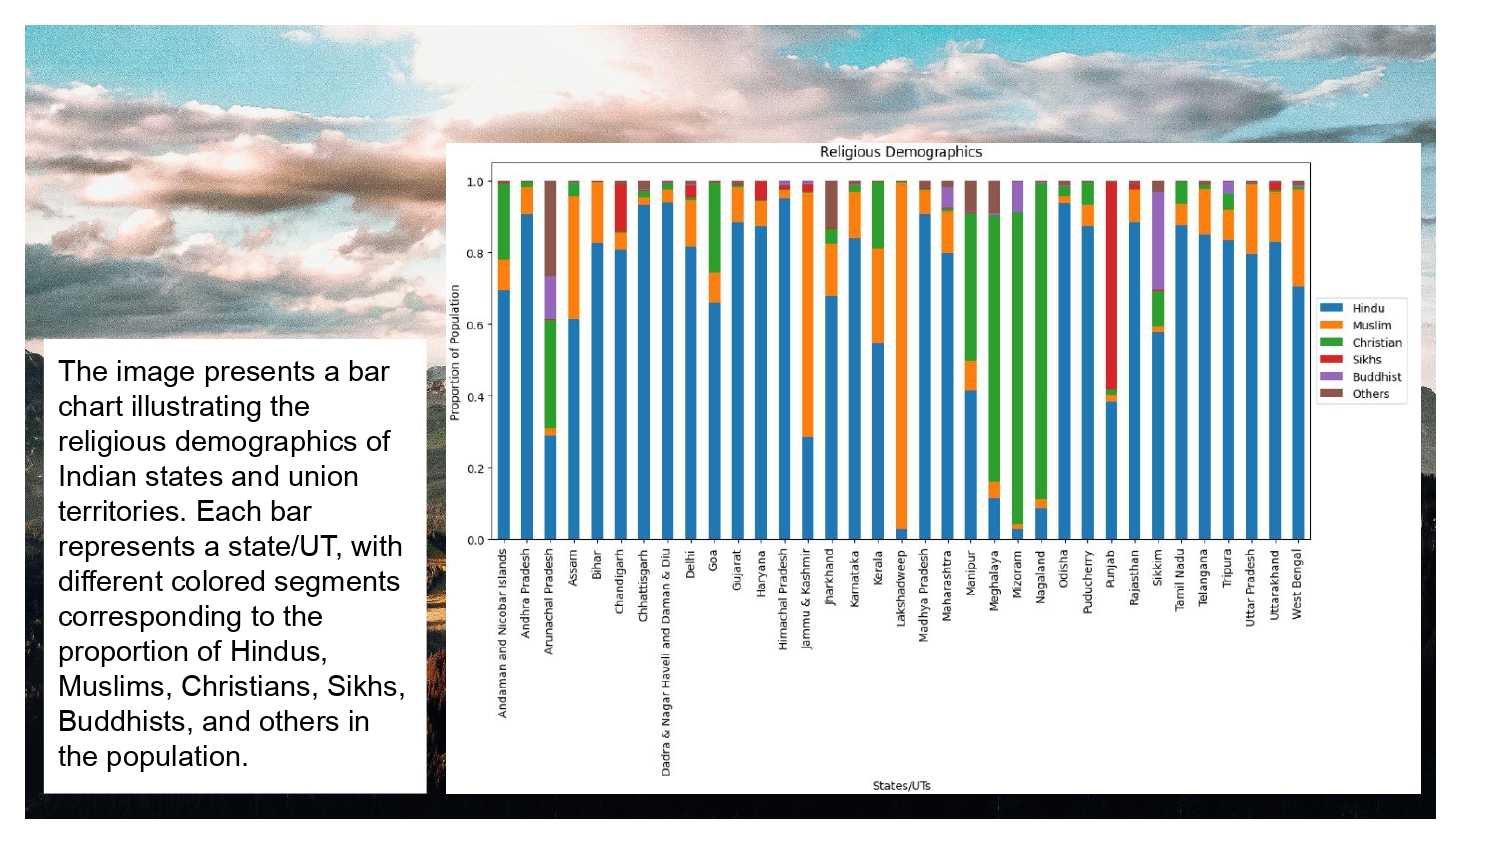
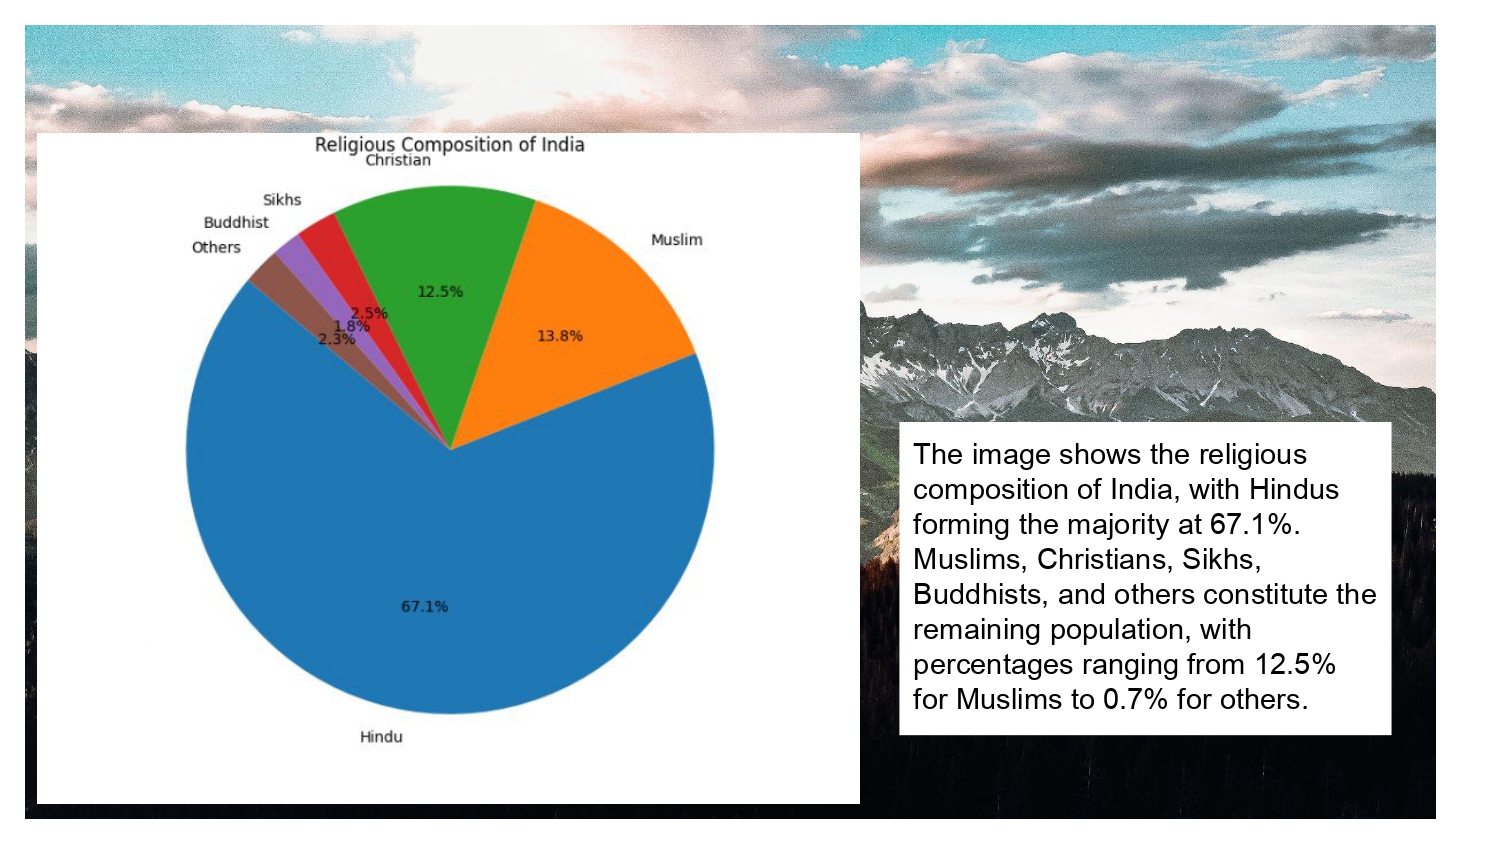
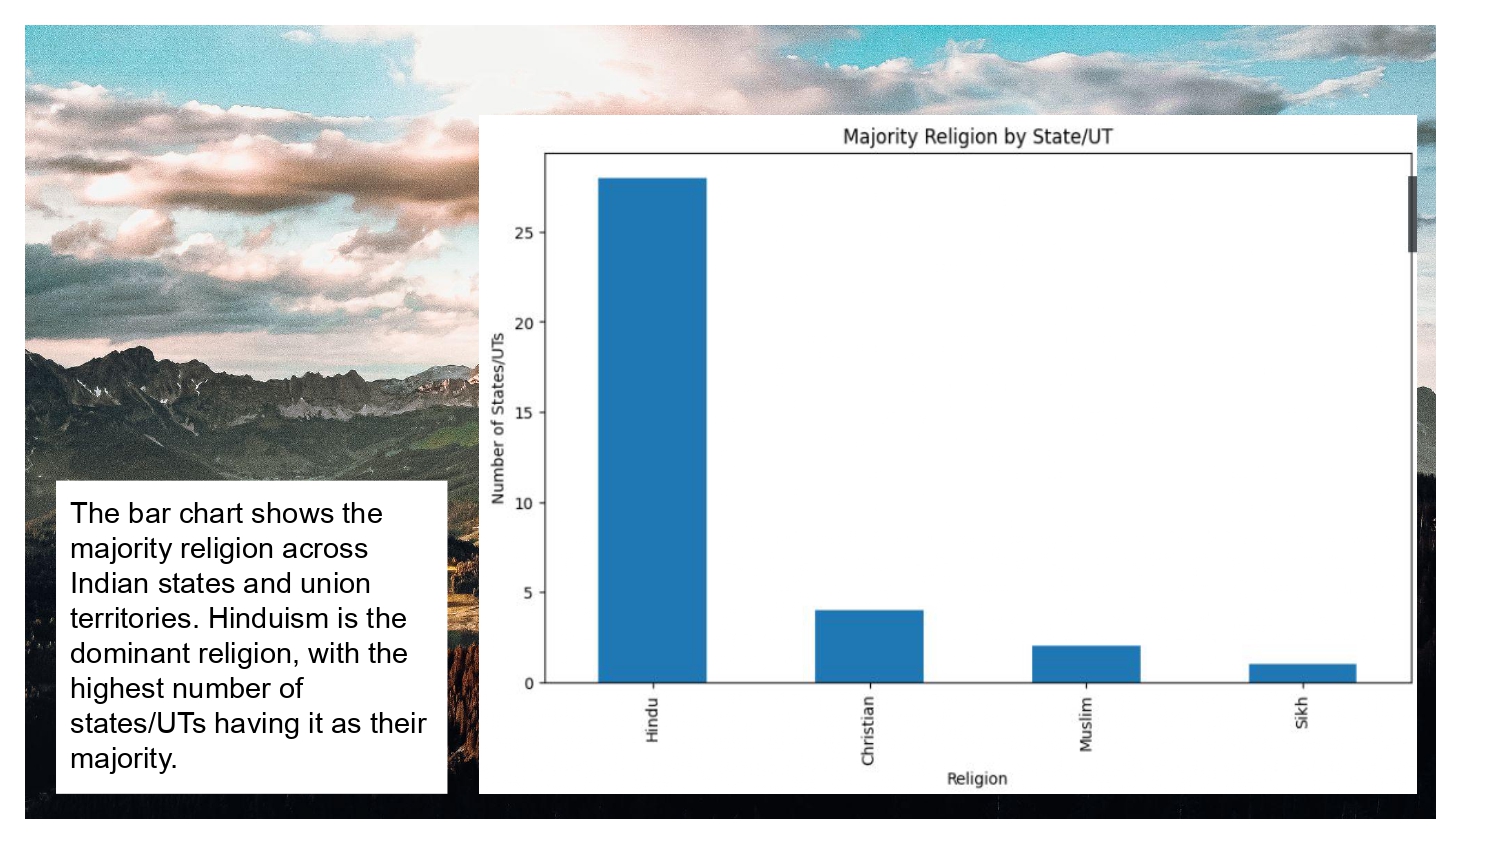
Religious Demographics
- Religious composition of India shows Hindus forming the majority at 67.1% of the population.
- Muslims constitute 12.5% of the population, followed by Christians, Sikhs, Buddhists, and others.
- Bar chart illustrating religious demographics across Indian states and union territories.
- Hinduism is the dominant religion with the highest number of states/UTs having it as their majority religion.
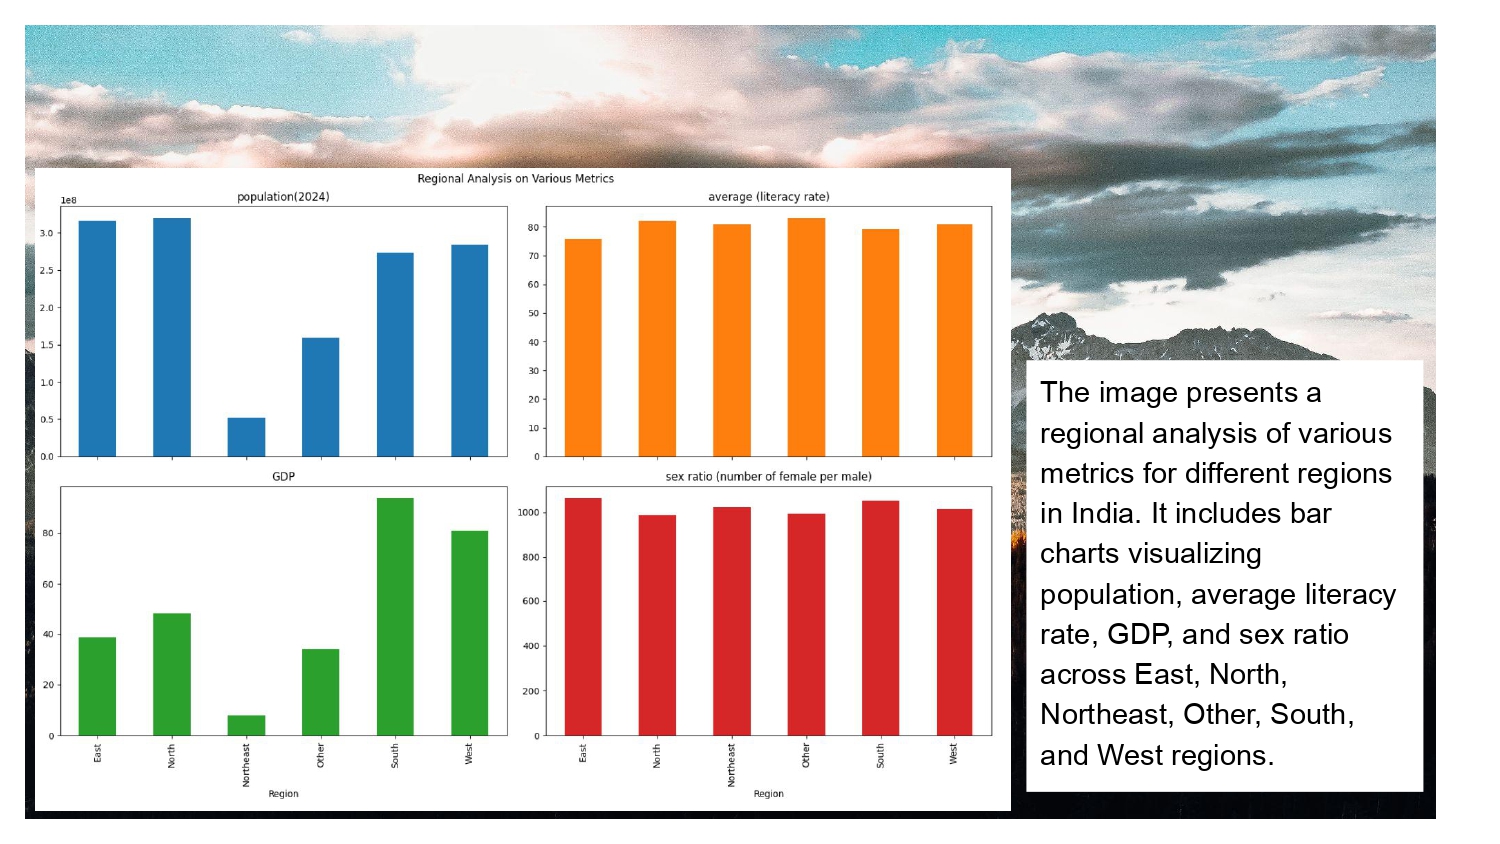
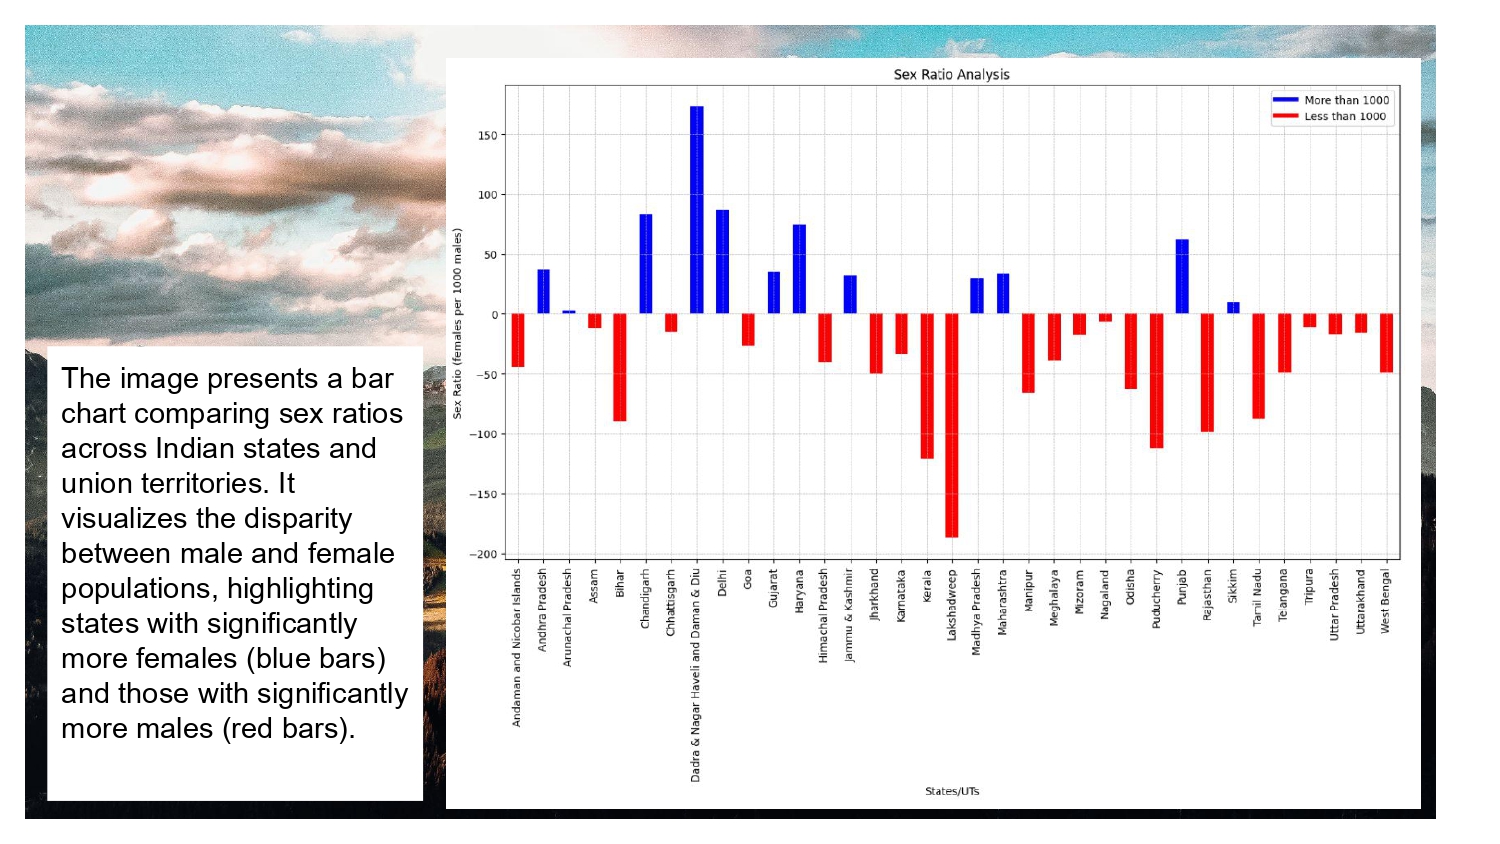
Regional Comparative Analysis
- Regional analysis covers East, North, Northeast, Other, South, and West regions of India.
- Bar charts visualizing population, average literacy rate, GDP, and sex ratio across different regions.
- Sex ratio comparison across Indian states showing disparity between male and female populations.
- Some states show significantly more females (blue bars) while others show more males (red bars).
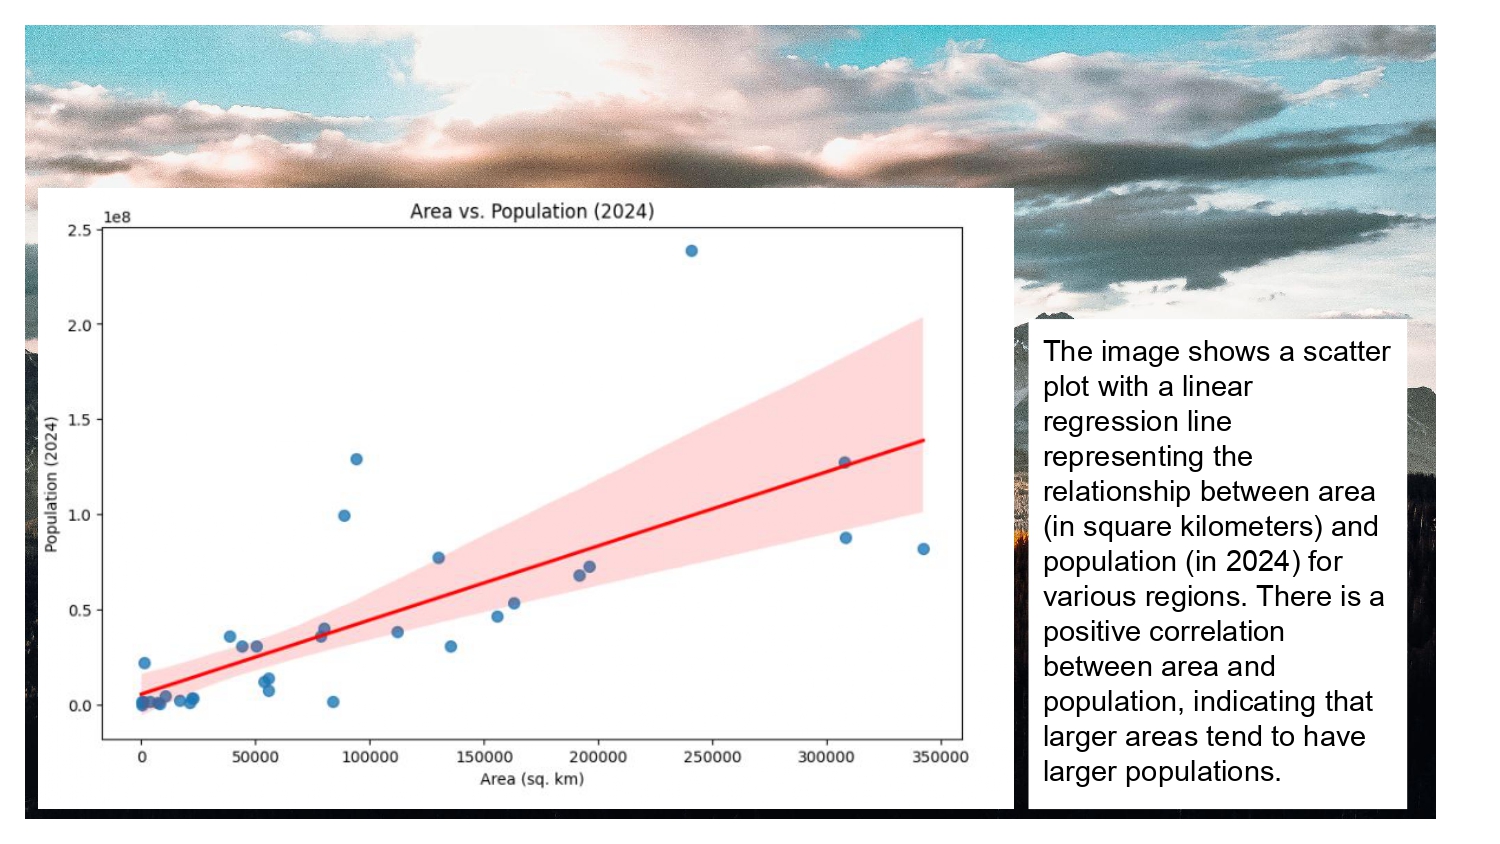
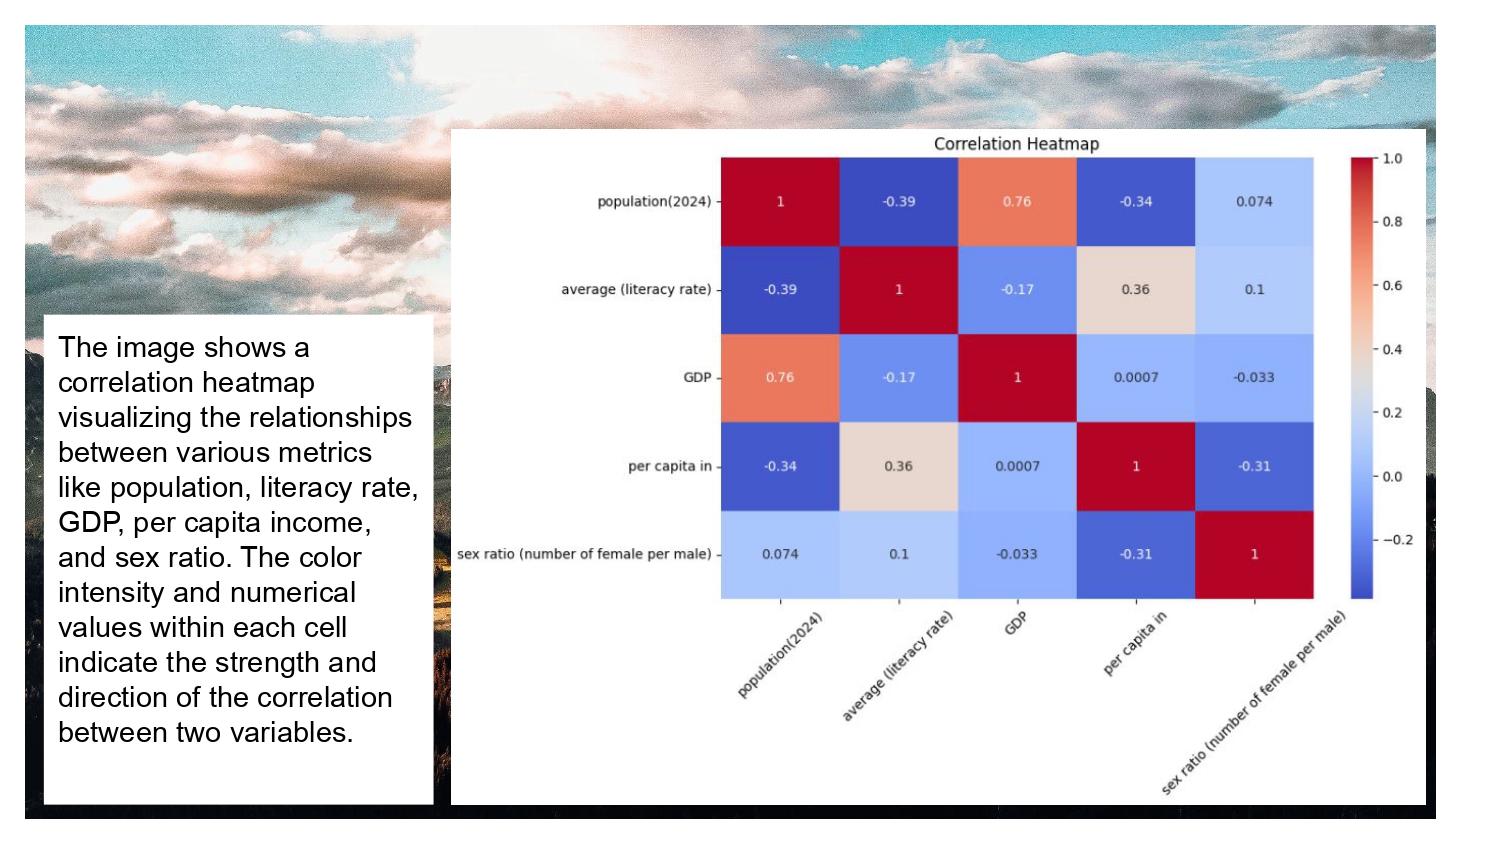
Data Correlation & Relationships
- Correlation heatmap visualizing relationships between population, literacy rate, GDP, per capita income, and sex ratio.
- Color intensity and numerical values indicate the strength and direction of correlation between variables.
- Scatter plot with linear regression line showing relationship between area and population for various regions.
- Positive correlation between area and population indicating larger areas tend to have larger populations.
This comprehensive analysis provides valuable insights into India's demographic and economic landscape. The data reveals significant variations across states and regions, highlighting the diverse nature of India's development patterns. The correlation analysis helps identify relationships between different socio-economic indicators, providing a foundation for policy decisions and regional development strategies.